User interface
Command-line interface
Generally, parsers commands have the form X -y or X --y where X is some command and y is some input argument. The single dash - is used to indicate an abbreviation while the double dash – is used to indicate the full word (such as -y versus --yellow). This is largely conventional.
At any point while using this interface, the inputs that may be entered from the command line can be displayed by entering the command followed by -h or --help (such as directions -h or directions --help)
Command |
Effect |
|---|---|
|
Can be used to query descriptions of the available features and commands. For additional help, type: |
|
Can be used to define general, simulator wide settings. For additional help, type: |
|
Can be used to define the settings of the virtual cohort. For additional help, type: |
|
Can be used to define the inputs of the simulated virtual cohort. For additional help, type: |
|
Can be used to define the activities of the simulated virtual cohort (currently only T1DM.ExtHovorka supports it). For additional help, type: |
|
Can be used to simulate the defined scenario and generate the results in the |
|
Can be used to visualize the results and generate figures. For additional help, type: |
|
Can be used to load a predefined scenario from the |
|
Can be used to reset the scenario to the default one (defaults). |
|
Quits the simulator. |
Defining a scenario
A scenario is a unique descriptor of a simulation. Outside of the simulator a scenario is described in a JSON file. The scenario is exported and can be reused later to make a simulation reproducable.
A set of predefined scenarios can be found in the ./Scenarios/ folder.
For a more detailed description of the scenario please refer here.
By running any of the (settings, cohort, inputs) command, the simulator shows the current state of the scenario in a table format. It highlights the modificaitons compared to the default scenario. settings allows the user to set broad settings such as the simulation sampling time and the duration in days. cohort allows the user to set virtual subject characteristics such as the model and type of diabetes or number of subjects. inputs allows the user to set model inputs such as carbohydrate intake, basal or bolus insulin therapy, or SGLT2I treatment.

There are various commands that can be used to generate simulation results. The key commands are settings, cohort, inputs, and simulate. These constitute the basic functional workflow of this interface and can be used in any order as long as simulate is entered after the other. This is because simulate will run a simulation with the currently defined settings.
There are several inputs available for the models. Currently, some of the inputs are common between models while others are model-specific.
The common inputs are meal and snack carbohydrates, which are given in grams either as a single, constant value or as a range for random sampling. Meals are given between 06:00-08:00 (breakfast), 12:00-14:00 (lunch), and 18:00-20:00 (dinner) between 30-60 minutes. A morning snack can be given between 09:00-11:00 and an afternoon snack can be given between 15:00-17:00. Snacks are between 5-15 minutes long.
The type 1 diabetes-specific model inputs are basal and bolus insulin, which are simply activated or deactivated and dosed based on meals and subject characteristics. The type 2 diabetes-specific model input is a sodium-glucose cotransporter-2 inhibitor, which is given in milligrams and dosed once-daily between 06:00 and 09:00. The model inputs are selected using the inputs command. Use inputs -h to learn more.
Command |
Effect |
|---|---|
|
Sets the simulation length to 3 days. |
|
Sets the cohort to type 1 diabetic and the model to an extended Hovorka. |
|
Loads the patient parameters from the Patient_1 and Patient_4 files. |
|
Sets the lunch carb range to be between 20 and 80 grams. |
|
Runs the defined scenario and saves the results. |
|
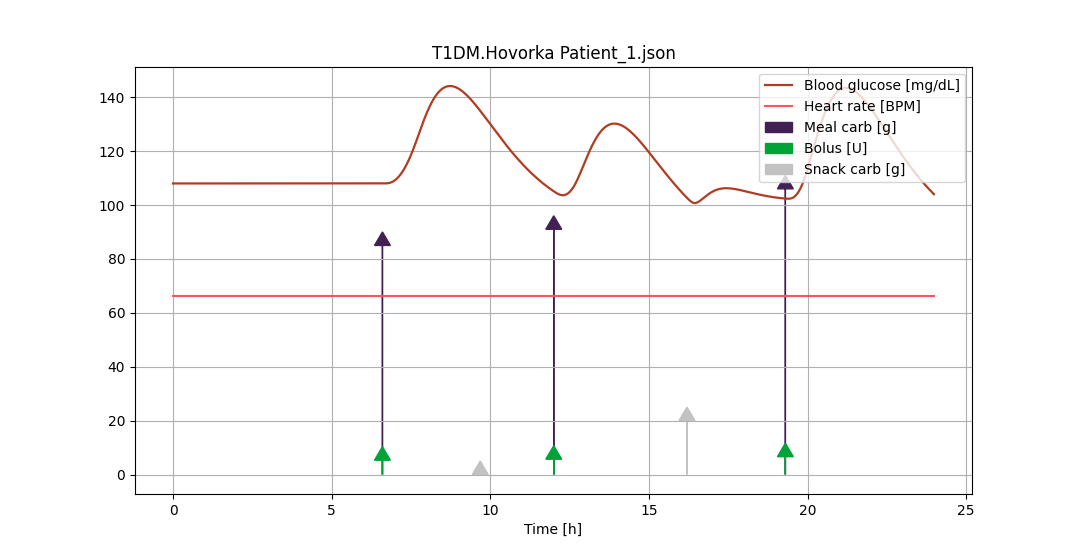
Generates a time series plot of inputs and outputs for Patient_1. |
Plots and exports
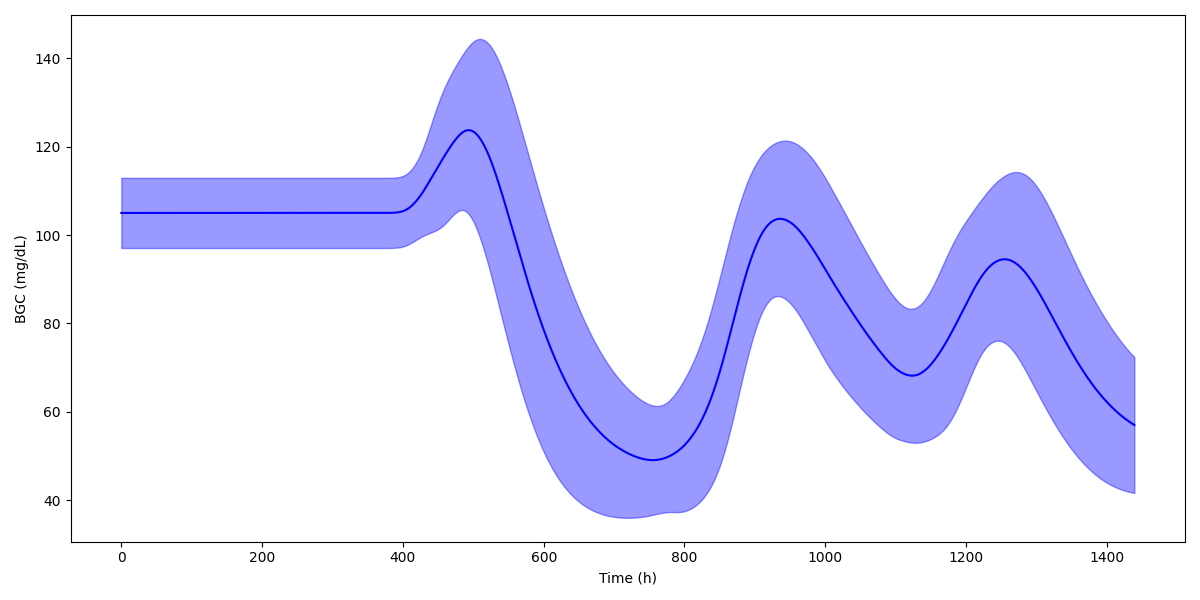
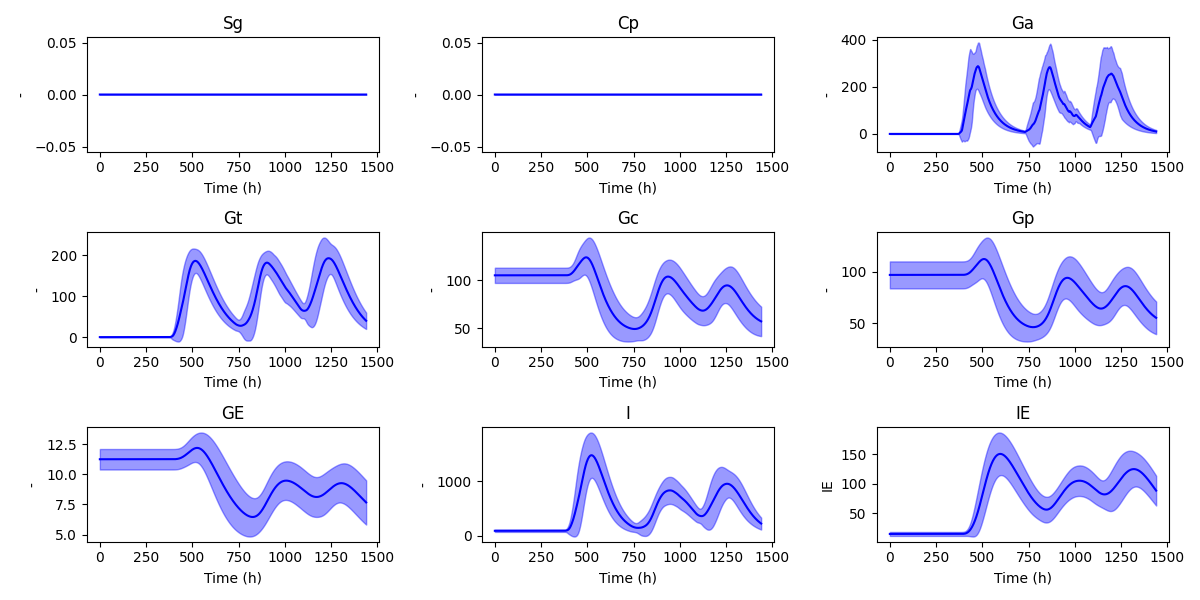
By running plot, the simulator generates figures and saves them but not shows them. In order to show the figures use plot -pa. Default figures visualize cohort wide time series plots of all the state variables of the given mathematical model. The other options are used to change display settings such as color and figure size.


To visualize input-output dynamics of a single patient use plot -pat <patient index>.

The simulate command has a single argument for formatting the model results in Microsoft Excel format. Running simulate will run a simulation with the currently-defined settings. If no other commands have been used, then a default simulation is run. These settings are displayed when the simulation is run.
Sg |
Cp |
Ga |
Gt |
Gc |
Gp |
GE |
I |
IE |
|
|---|---|---|---|---|---|---|---|---|---|
(mg) |
(ng/mL) |
(mmol) |
(mmol) |
(mmol) |
(mmol) |
(mmol) |
(mIU) |
(mIU) |
|
0 |
0.0 |
0.0 |
0.0 |
0.0 |
121.3 |
87.4 |
13.0 |
112.1 |
18.4 |
1 |
0.0 |
0.0 |
0.0 |
0.0 |
121.3 |
87.4 |
13.0 |
112.1 |
18.4 |
2 |
0.0 |
0.0 |
0.0 |
0.0 |
121.3 |
87.4 |
13.0 |
112.1 |
18.4 |
3 |
0.0 |
0.0 |
0.0 |
0.0 |
121.3 |
87.4 |
13.0 |
112.1 |
18.4 |
4 |
0.0 |
0.0 |
0.0 |
0.0 |
121.3 |
87.4 |
13.0 |
112.1 |
18.4 |
5 |
0.0 |
0.0 |
0.0 |
0.0 |
121.3 |
87.4 |
13.0 |
112.1 |
18.4 |